Stop Building Static Cash Curves: How to Design a Reusable, Schedule-Driven Project Control Workbook in Standard Excel
An architectural blueprint for building a unified, schedule-driven project control workbook in native Excel—linking As-Bid items, DOT progress S-curves, and monthly cash flow without macros.
Alternative Headline: From As-Bid Items to S-Curves: The Unified Excel Engine Behind Project Schedules, Progress Tracking, and Cash Forecasting
A civil contractor recently brought us two spreadsheet requests a few weeks apart.
First, the project team needed a two-page Department of Transportation (DOT) progress schedule for a highway rehabilitation bid. Page one required a printable bar chart schedule with standard contract header fields (Project, Contract #, County, Date, and Contractor) formatted for Letter and 11x17 paper. Page two required a cumulative progress S-curve running from 0% to 100%, driven by activity weights totaling 100%. Both sheets had to run in standard Microsoft Excel without paid add-ins or macros.
Three weeks later, the same team reached out with a second request. They had a spreadsheet containing their job As-Bid Items and target completion dates, and they needed a project Cash Curve. Their existing template produced erratic monthly totals and broke whenever field dates shifted. They wanted a repaired workbook that reflected the actual construction schedule and could be reused across future bids.
On the surface, those look like two separate deliverables: a field scheduling tool for the resident engineer, and a financial forecasting sheet for commercial tracking.
In practice, treating them as two separate spreadsheets is the primary reason project templates fail. When a team builds a Gantt chart on one tab and a cash forecast on another, every two-week weather delay forces someone to spend Friday afternoon manually retyping monthly dollar allocations.
A reliable Cash Curve is a direct mathematical projection of your project schedule. Once you connect your As-Bid Items to a single time-phased calculation engine in standard Excel, changing one start date or duration automatically updates three views at once: your printable Gantt bar chart, your 0% to 100% Progress S-Curve, and your cumulative dollar Cash Curve.
Below is the architectural blueprint for building that unified, three-layer project control workbook in native Excel, including the column schemas, period-overlap formulas, granularity mapping techniques, and operational boundary conditions.
1. Why Project Curves Break the Moment a Schedule Shifts
When a cash curve template built on bid items and completion dates fails to reflect the field schedule, the breakdown almost always stems from two structural gaps in how the workbook stores time and value.
Structural Gap A: The "Completion Date Only" Trap
Many estimating templates start with a bid tabulation export. The sheet lists each pay item, its contract dollar value, and a single column labeled Completion Date. To build a monthly cash curve from that table, the author writes a SUMIFS formula that sums all bid items whose completion date falls within each calendar month.
Consider what happens when you model a $400,000 Paving operation scheduled to begin on April 16 and finish on May 31. Because the table only records May 31 as the completion date, a SUMIFS formula assigns $0 to April and dumps the entire $400,000 into May.
Field production occurs continuously over the active duration of a work package. Crews mobilize, grade, haul material, and place asphalt across those six weeks. Relying on a single completion date turns a smooth cumulative S-curve into a jagged staircase of artificial end-of-month spikes. Worse, if a two-day rain delay pushes that completion date from May 31 to June 2, the entire $400,000 vanishes from May and leaps into June, distorting two months of financial projections from a minor schedule slip.
Structural Gap B: Disconnected Schedule and Cost Sheets
The second failure mode occurs when teams recognize the need for multi-month spreading, but execute it by hand. The project manager maintains a bar chart schedule on Sheet 1 by coloring cells or adjusting bar lengths, while the estimator maintains a monthly cash table on Sheet 2 by typing estimated dollar amounts into monthly columns (Feb, Mar, Apr, May, Jun).
The moment the baseline schedule changes, the two tabs diverge. Updating a start date on the Gantt chart leaves the monthly dollar columns untouched. The workbook splits into two disconnected drawings that require manual reconciliation every reporting cycle.
2. Bid Amounts Are Activity Weights in Dollars: The Unified Mathematical Model
A Progress S-Curve and a Project Cash Curve share the exact same mathematical structure. Both models take a list of work elements, distribute their value across discrete time buckets based on scheduled duration, and accumulate those periodic increments from project start to completion.
Every schedule-driven curve follows a six-stage computational pipeline:
Project Work Structure -> Activities / As-Bid Items -> Time Dimension (Start & Duration) -> Period Allocation -> Weighted Value -> Cumulative Curve
The single distinction between a physical progress curve and a financial cash curve is the unit of weight assigned to each row:
- In a Progress S-Curve, each activity carries a normalized Activity Weight ($w_i$) expressed as a percentage of total project effort ($\sum w_i = 100%$).
- In a Project Cash Curve, each item carries its As-Bid Amount ($B_i$) in dollars, where the sum of all bid items equals the Total Contract Value.
Because every bid item represents a specific share of the total contract price, its dollar amount is already an unnormalized activity weight. Divide each item's bid amount by the total contract value to obtain its exact percentage weight:
Activity Weight (w_i) = Bid Amount_i / Total Contract Value
Illustrative Example: A Four-Activity Civil Contract
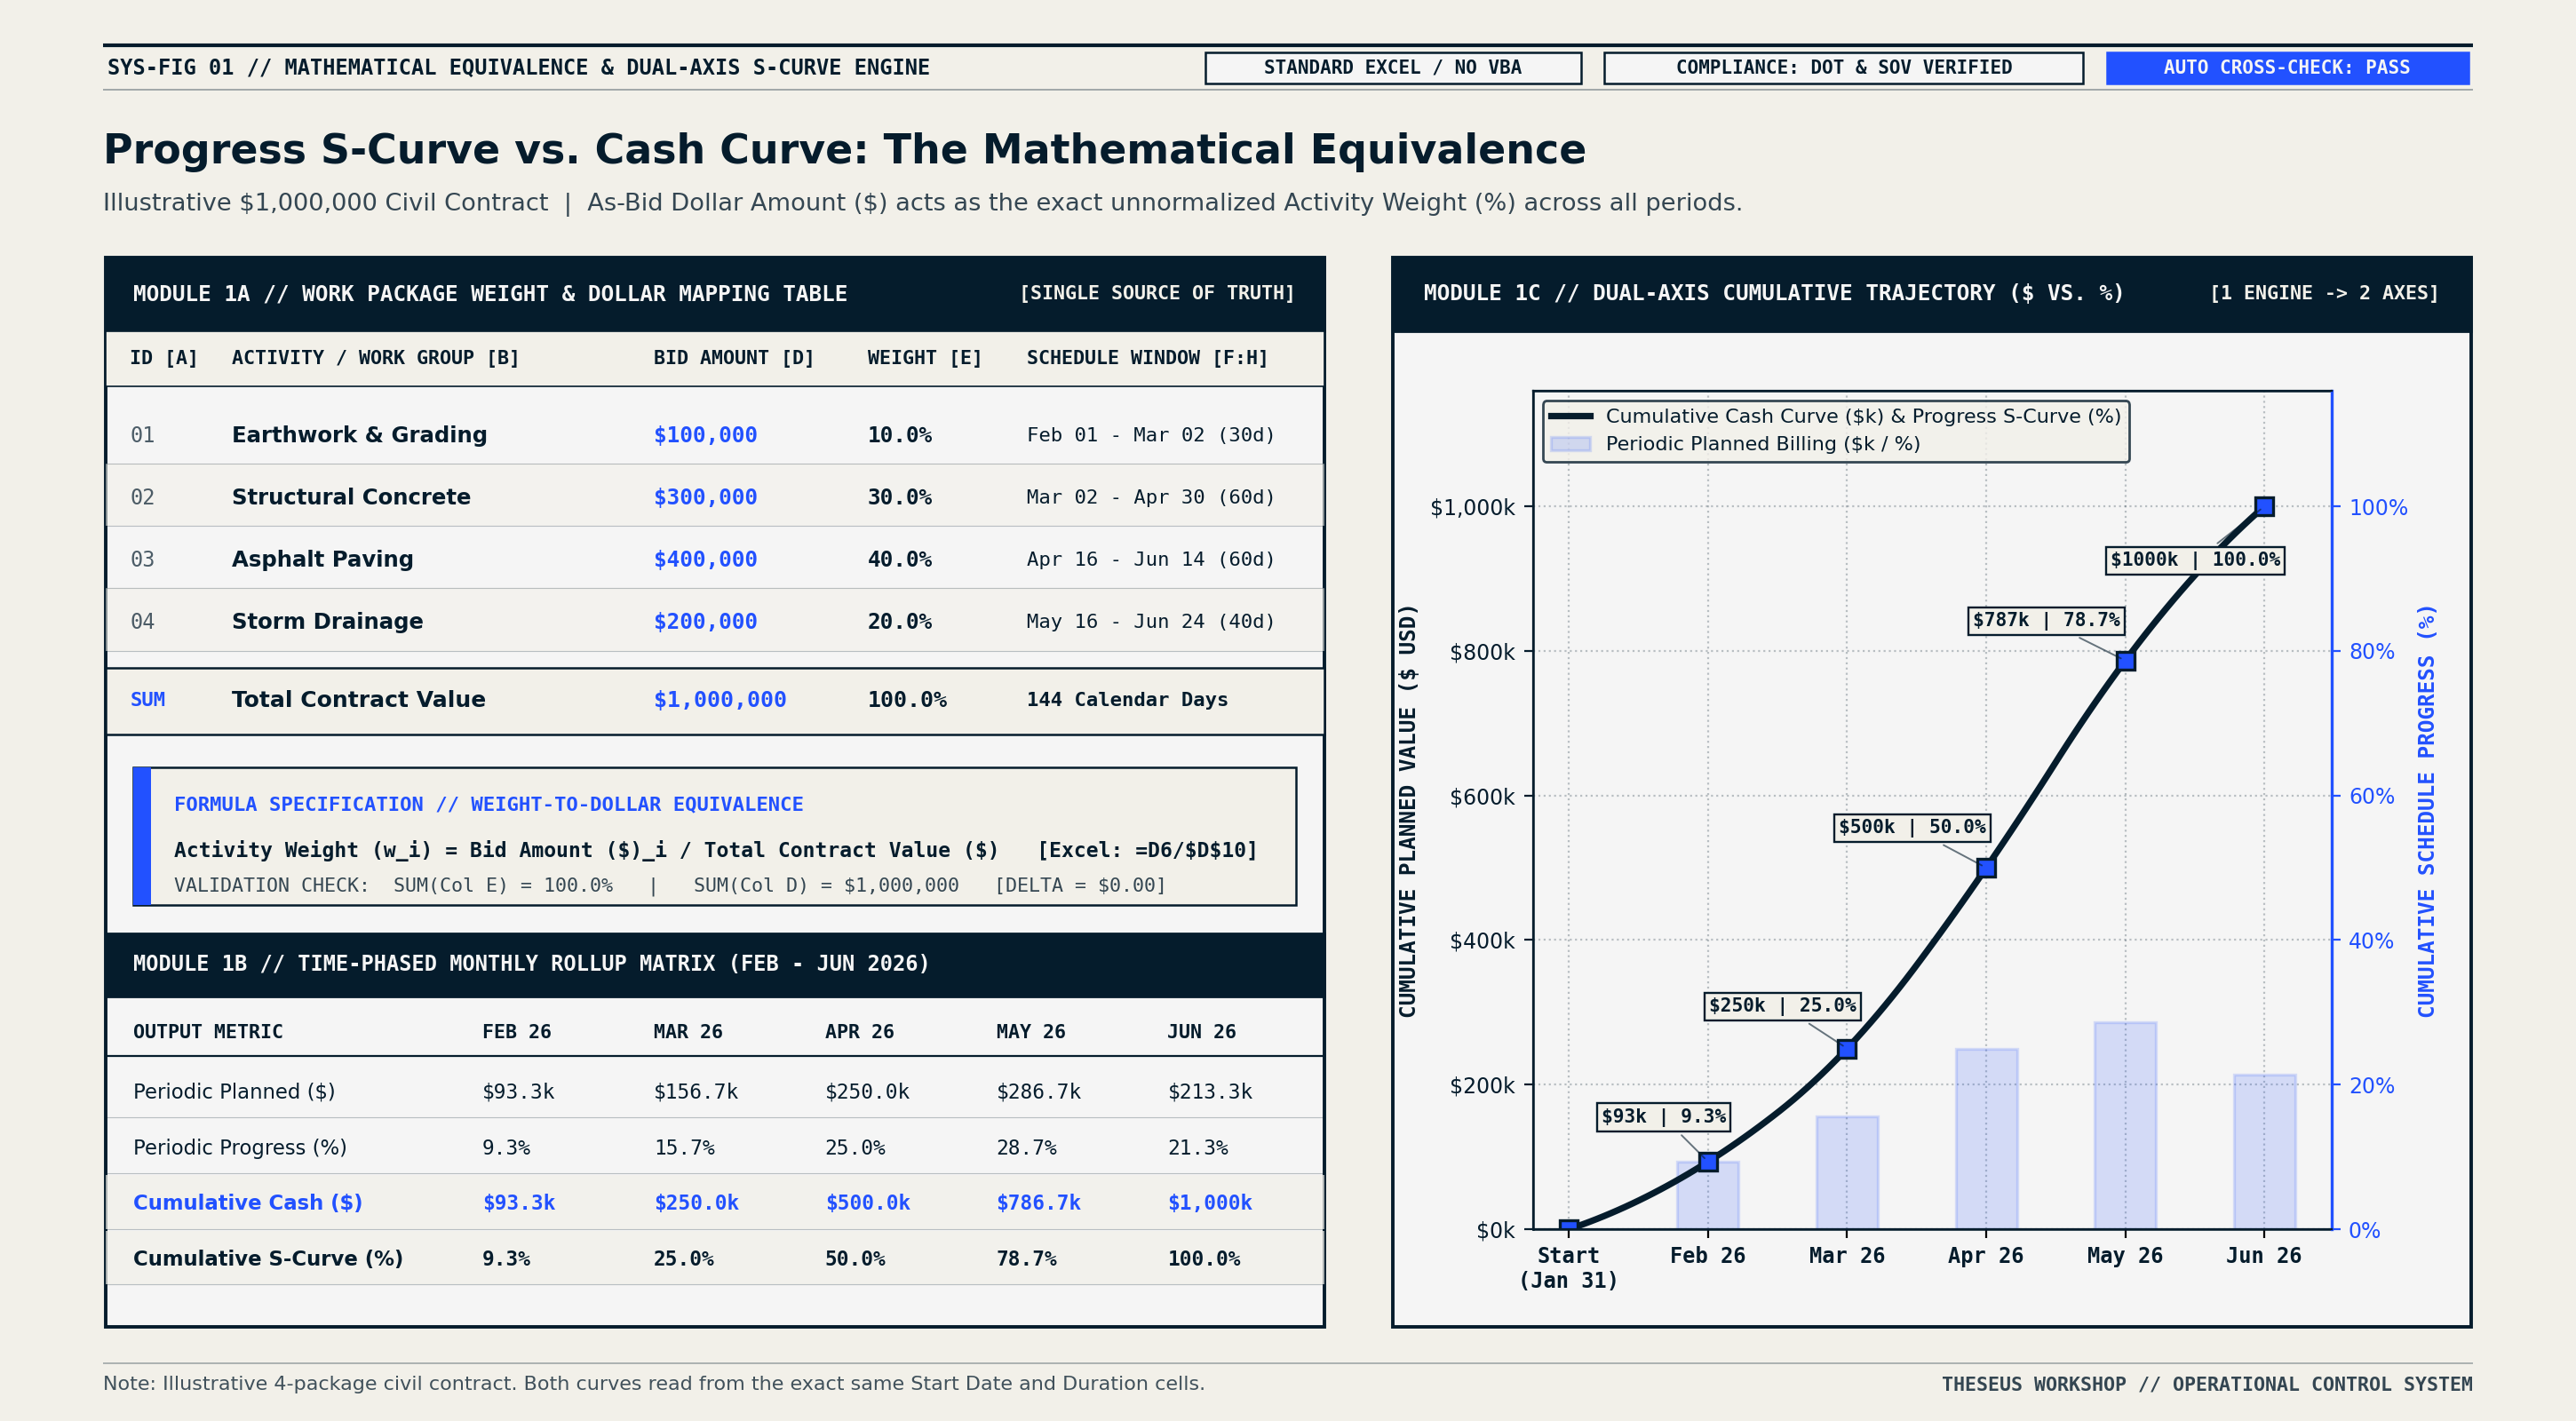
To see this equivalence in action, consider a simplified $1,000,000 civil construction contract broken into four primary work packages running from February through June (used here as an illustrative example to demonstrate the calculation mechanics):
| ID | Work Group / Activity | As-Bid Amount ($) | Weight (%) | Start Date | Finish Date | Duration |
|---|---|---|---|---|---|---|
| 01 | Earthwork & Grading | $100,000 | 10.0% | Feb 1, 2026 | Mar 2, 2026 | 30 Days |
| 02 | Structural Concrete | $300,000 | 30.0% | Mar 2, 2026 | Apr 30, 2026 | 60 Days |
| 03 | Asphalt Paving | $400,000 | 40.0% | Apr 16, 2026 | Jun 14, 2026 | 60 Days |
| 04 | Storm Drainage | $200,000 | 20.0% | May 16, 2026 | Jun 24, 2026 | 40 Days |
| Total | Contract Total | $1,000,000 | 100.0% | Feb 1, 2026 | Jun 24, 2026 | 144 Days |
Look at 02 Structural Concrete. In a dollar-based Cash Curve, that row contributes $300,000 out of $1,000,000. In a percentage-based DOT Progress S-Curve, that exact same row contributes 30.0% out of 100.0%.
Because Structural Concrete runs for 60 calendar days (30 days in March and 30 days in April), it generates half of its value in March ($150,000 / 15.0% progress) and half in April ($150,000 / 15.0% progress). Plotting cumulative dollars on the primary vertical axis ($0 to $1,000,000) and cumulative progress percentage on the secondary vertical axis (0% to 100%) places both S-curves directly on top of one another. One schedule-driven engine outputs both units simultaneously.
3. Building the Three-Layer Calculation Engine in Standard Excel
To make a workbook reusable across projects without relying on third-party plugins or VBA macros, separate the spreadsheet into three functional layers:
- Layer 1: The Structured Input & Mapping Layer (where estimators enter bid items and schedulers set dates).
- Layer 2: The Time-Phased Allocation Matrix (where locked native formulas calculate Gantt offsets and periodic overlaps).
- Layer 3: Dual-View Printable Outputs (where print-ready charts read directly from the calculation layer).
Layer 1: The Structured Input and Mapping Layer
Every row in the core engine requires eight structured columns. Keeping user inputs separated from calculated columns prevents accidental formula overwrites when setting up a new job:
| Col | Header Name | Type | Purpose & Native Excel Logic |
|---|---|---|---|
| Col A | Item ID |
Input (Blue) | Pay item number or activity code (203-01 or ACT-02). |
| Col B | Description |
Input (Blue) | Scope name (Structural Concrete, Asphalt Paving). |
| Col C | Work Group |
Input (Blue) | Maps detailed bid items to summary schedule activities. |
| Col D | Bid Amount ($) |
Input (Blue) | Contract value (Quantity * Unit Price or Lump Sum). |
| Col E | Weight (%) |
Formula (Gray) | =D6 / $D$10 (Item Bid Amount / Total Contract Value). |
| Col F | Start Date |
Input / XLOOKUP |
Scheduled start date of the activity (2026-03-02). |
| Col G | Duration (Days) |
Input / XLOOKUP |
Active calendar or working days required (60). |
| Col H | Finish Date |
Formula (Gray) | =F6 + G6 - 1 (Inclusive finish date). |
Solving the Granularity Mismatch Between Bid Items and Schedule Activities
In real construction contracts, a highway or municipal infrastructure bid might contain 80 to 150 unit-price pay items (Quantity * Unit Price), whereas the DOT progress schedule tracks 12 to 20 major construction activities.
Maintaining 150 separate start and finish dates manually whenever a project shifts creates immediate version-control errors. The Work Group column (Col C) resolves this mismatch. Keep a clean 15-row Master Schedule Table for your Gantt chart where you manage the Start Date and Duration of each major work package (Earthwork, Concrete, Paving, Drainage). Then, in your 150-row As-Bid Items Table, assign each pay item to its parent Work Group and pull its dates automatically using XLOOKUP:
=XLOOKUP(C6, MasterSchedule!$A$6:$A$20, MasterSchedule!$C$6:$C$20)
=XLOOKUP(C6, MasterSchedule!$A$6:$A$20, MasterSchedule!$D$6:$D$20)
With this relational bridge in place, your estimator pastes in 150 raw As-Bid items, tags each one to its parent activity once, and controls the entire financial forecast by updating the 15 dates on the master schedule.
Layer 2: The Time-Phased Allocation Matrix
Immediately to the right of the input columns, build the two sub-engines that drive the Gantt bars and the periodic time buckets.
Part 1: Driving the Native Excel Gantt Chart (Start Offset + Duration)
To build a dynamic Gantt chart in standard Excel without coloring grid cells manually, add one calculated helper column in Col I called Start Offset:
=F6 - $C$2
Insert a horizontal Stacked Bar Chart using Start Offset (Col I) as Series 1 and Duration (Col G) as Series 2. Format Series 1 with No Fill / No Line. Series 1 acts as an invisible spacer that pushes each visible duration bar to its exact calendar start date. Change Start Date or Duration in the table, and the Gantt bars slide and resize automatically.
Part 2: The Period Overlap Formula (Spreading Value Across Time Buckets)
Next, set up your periodic timeline columns across Col J through Col U (weekly or monthly buckets). In Row 3, store the first day of each period ($P_{\text{start}}$, such as 2026-03-01). In Row 4, calculate the last day of each period ($P_{\text{end}}$, using =EOMONTH(J3, 0) for 2026-03-31).
For any activity $i$ with start date $S_i$, finish date $F_i$, and inclusive duration $D_i = F_i - S_i + 1$, the calculation engine determines how many active days ($d_{i,t}$) fall inside time bucket $t$ bounded by $[P_{\text{start}}, P_{\text{end}}]$.
Mathematically, the intersection of two closed intervals $[S_i, F_i]$ and $[P_{\text{start}}, P_{\text{end}}]$ begins at $\max(S_i, P_{\text{start}})$ and ends at $\min(F_i, P_{\text{end}})$. Wrapping the difference in MAX(0, ...) prevents negative numbers when an activity occurs entirely before or after the current month:
Active Overlap Days = MAX(0, MIN(Finish_Date, Period_End) - MAX(Start_Date, Period_Start) + 1)
Assuming $F6 is Start Date, $G6 is Duration, $H6 is Finish Date, J$3 is Period Start, and J$4 is Period End, the formulas for active overlap days and direct period allocation in cell J6 are:
// 1. Overlap Days in Period J:
=MAX(0, MIN($H6, J$4) - MAX($F6, J$3) + 1)

// 2. Direct Period Cash ($) and Progress (%) Allocation:
=$D6 * (MAX(0, MIN($H6, J$4) - MAX($F6, J$3) + 1) / $G6)
=$E6 * (MAX(0, MIN($H6, J$4) - MAX($F6, J$3) + 1) / $G6)
Verifying this logic on 02 Structural Concrete ($300,000 bid amount, 30.0% weight, starting March 2, 2026, finishing April 30, 2026, duration = 60 days):
- February (
Feb 1toFeb 28):MIN(Apr 30, Feb 28) - MAX(Mar 2, Feb 1) + 1 = -1->MAX(0, -1)returns0 days-> $0 (0.0%). - March (
Mar 1toMar 31):MIN(Apr 30, Mar 31) - MAX(Mar 2, Mar 1) + 1 = 30 days->30 / 60 = 50%-> $150,000 (15.0%). - April (
Apr 1toApr 30):MIN(Apr 30, Apr 30) - MAX(Mar 2, Apr 1) + 1 = 30 days->30 / 60 = 50%-> $150,000 (15.0%). - May (
May 1toMay 31):MIN(Apr 30, May 31) - MAX(Mar 2, May 1) + 1 = 0-> returns0 days-> $0 (0.0%).
Across all months, the horizontal sum equals $300,000 and 30.0%.
Layer 3: Dual-View Printable Outputs
Generating the final deliverables requires two summary rows at the bottom of the allocation matrix and two formatted output tabs:
- Row 20 (Periodic Planned Total in
$and%):=SUM(J6:J19)sums the value earned inside columnJto drive a monthly billing histogram. - Row 21 (Cumulative Running Total in
$and%):=SUM($J$20:J20)locks the first period column ($J$20) and accumulates value throughJ20to drive the smooth S-Curve.
In your finished workbook:
- Sheet 1 (DOT-Style Bar Chart Schedule) displays the contract header block (
Project: Highway 42 Bridge Rehab,Contract #: DOT-2026-08,County: Wake,Contractor: Apex Civil Constructors), the activity table, and the aligned Stacked Bar Gantt chart scaled to an 11x17 or Letter page. - Sheet 2 (Progress S-Curve & Cash Curve) displays the monthly schedule of values table alongside the dual-axis cumulative curve chart ($0 to $1,000,000 on the left axis, 0% to 100% on the right axis).
4. Real-World Engineering Trade-offs and Boundary Conditions
Before deploying this time-phased engine on a live contract, project teams must account for three practical engineering and financial boundary conditions.
Trade-off 1: Linear Distribution vs. Front-Loaded Procurement
The overlap formula (Overlap_Days / Total_Duration) rests on a Linear Distribution Assumption: it spreads an activity's dollar value evenly across every calendar day of its duration.
For crew-driven field operations such as earthwork grading, aggregate base placement, or asphalt paving, daily production is reasonably uniform. However, items like Mobilization and Performance Bonds or Precast Concrete Girder Fabrication require heavy upfront deposits weeks before field installation begins.
Lumping a $200,000 precast material deposit into a 60-day bridge erection activity causes a linear formula to smear that upfront cost across two months. Rather than writing complex non-linear equations that are difficult to audit, use a structural fix in the input table: split front-loaded items into two rows. Enter 02A - Precast Material Deposit ($80,000) as a 1-day milestone (Duration = 1) on the order date, and enter 02B - Precast Field Erection ($120,000) across the 60-day installation window. Every cell keeps the same linear formula while capturing the upfront billing spike.
Trade-off 2: Planned Billing Value vs. Actual Bank Cash Flow
Project managers and small business owners must distinguish between Planned Value (Earned/Billing Curve) and Actual Net Cash Flow.
A Cash Curve derived from As-Bid Items and schedule dates measures when billable contract value is earned in the field (your projected monthly Pay Application or Schedule of Values submission). Actual bank deposits differ from planned billing due to two contractual mechanisms:
- Retainage Withholding: Owners and general contractors typically withhold 5% to 10% of each monthly progress billing until substantial completion.
- Payment Terms Lag: After submitting a monthly pay application at the end of March, inspection certification and Net 30 or Net 45 payment terms mean those funds arrive in May.
To model corporate working capital, add two summary rows beneath your Cumulative Billing line on Sheet 2:
Net Monthly Invoice (After 10% Retainage):=J20 * (1 - $Retainage_Pct)Expected Cash Receipt (30-Day Lag):=I22(referencing the prior month's net invoice, plus retainage release at closeout).
Trade-off 3: Designing for Cross-Project Reusability
To make the workbook a reusable company standard across future bids, build three safeguards into the template:
- Color-Coded Cell Governance: Format manual entry cells (
Bid Amount,Start Date,Duration) with dark blue text, and format calculated columns (Weight %,Finish Date,Start Offset, and the Allocation Matrix) with gray headers and worksheet protection. - Dynamic Rolling Timeline Headers: Anchor Cell
J3to=DATE(YEAR($Project_Start), MONTH($Project_Start), 1)and generate subsequent month headers via=EDATE(J3, 1)and=EOMONTH(K3, 0). Entering a newProject Start Daterebuilds the entire multi-month calendar grid automatically. - Self-Auditing Reconciliation Checks: Add a
Row Checkcolumn at the far right of the allocation matrix (Col V) that compares the horizontal sum of allocated monthly dollars against the originalBid AmountinCol D:
=IF(ABS(SUM(J6:U6) - D6) > 0.01, "ERROR: Check Dates", "OK")
If a finish date extends past the last column of the timeline or a duration is mistyped, the check cell flags the discrepancy immediately so every dollar is accounted for on the S-Curve.
5. The Six-Point Workbook Audit: Relieving the Exhaustion of Everyday Decisions
Before sending your next project schedule or cash forecast to an owner, lender, or agency engineer, run your Excel file through this six-point structural audit:
- Single Source of Truth: Do your Gantt chart, Progress S-Curve, and Cash Curve all read from the exact same
Start DateandDurationcells, with zero manual copy-pasting between tabs? - Full Interval Definition: Does every bid item or work package have both a
Start Dateand aDurationrather than a standaloneCompletion Date? - Granularity Bridge: Are detailed unit-price As-Bid items mapped to summary schedule activities via a
Work Grouplookup (XLOOKUP), allowing you to update 15 schedule dates instead of 100+ pay item rows? - Dynamic Interval Overlap: Does your time-phased matrix calculate periodic allocations using
=MAX(0, MIN(Finish, Period_End) - MAX(Start, Period_Start) + 1)rather than hardcoded monthly percentages? - Explicit Boundary Adjustments: Are upfront material deposits isolated as short-duration milestones, and are retainage and payment lags separated when forecasting bank cash flow?
- Horizontal Self-Audit: Does a reconciliation column verify that $\sum \text{Activity Weights} = 100%$ and that the horizontal sum of allocated periodic dollars equals 100% of the Total Contract Value?
Small and mid-sized contractors, project managers, and estimators rarely need heavyweight enterprise software or paid spreadsheet add-ins to produce a compliant bar chart and an accurate cash curve. Most spreadsheet rework happens when a static drawing is asked to do the job of a calculation engine.
At Theseus Workshop, we build lightweight operational tools that relieve you from the exhaustion of everyday decisions. Structuring standard Excel around clear, explainable data models (where inputs, time-phased calculations, and printable views stay separated) turns hours of repetitive Friday-afternoon rework into a single date update.
Instruments Machined for a Lifetime of Making.
Every principle discussed in our journal is physically realized in our atelier instruments. Explore our calibrated naval brass measurement gauges, precision scribes, and heavy 18oz duck canvas shop gear.
Theseus Atelier Note
Articles are published periodically as physical shop trials conclude. Every specification is verified on hand-scraped master plates.